 |
| A light dusting of snow |
The weather has been rather strange recently hasn't it with late cold snaps and unexpected snow. Perhaps that's why we decided to make our own weather reports. To chart the weather for a week and see what we found out.
I know a week isn't very long but this was just a beginning. An overture if you like into the world of scientific observation, chart making and eventually data interpretation.
It was a great way of making science fun by combining a crafty activity (chart design and execution) with a hands on one (checking the local weather outdoors) and a computer based one (looking up the wind direction and the weather in other locations).
 |
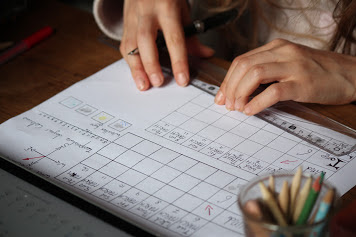
| Maya preparing her charts |
Observation
Before I tell you how we went about making our charts, I'd like to talk about observation. As I mentioned in previous posts, I think it's important that kids learn about and apply the Scientific Method. Observation is for me one of the cornerstones of any good scientist's (and artist's for that matter!) approach to his work.
"Observation is essential in science. Scientists use observation to collect and record data, which enables them to construct and then test hypotheses and theories."
Science Learning HubObserving something and recording your results is a classic scientific activity. Charting your observations is one way of recording your data.
Encouraging observation skills can begin very early with very young children. It starts by talking to them about things you notice like new buds on the trees or the first blossom. Or how the iced over puddles look like they have trapped stars in them. These kinds of observations encourage children to look closely at things. They foster an attitude of wonder faced with the magic or science of the natural world.
 |
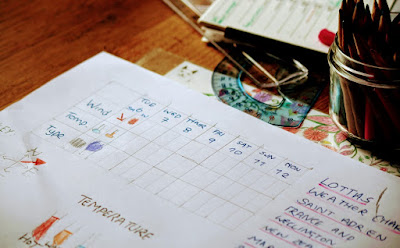
| Lotta's Weather Chart |
Record making
This time we chose charts or tables to record our observations. We often record our natural science observations in nature journals (herbiers) and water colour sketches.Combining craft and science is probably one of the most effective ways of making science fun for kids. Although this is often fostered in younger children, older kids often miss out on the crafty side of things in school as the work environment gets more serious and focussed on written records. I think that's a great shame as artwork and making things can really help invigorate their studies and help things stick in their minds.
 |
| Rainy day in New York City |
 |
| Snow falling in Paris |
Why weather?
My kids have always been interested in the weather and the seasons. They're used to observing it and using that information to fill in the little calendar we have up on the wall. Furthermore, choosing the weather for our first chart making task made this a cross-over activity covering concepts from maths and geography as well as scientific method. |
| A book we used for inspiration |
How we did it
- First we talked about what a chart is and why we might want to make a record of the weather. We also discussed how meteorologists gather their data.
- We looked at some examples of weather charts and decided to chart the weather in our commune (local area), St Barthélémy. Both girls also picked another place to chart.
- We agreed our charts would cover one week and record wind direction, temperature and weather type.
- We drew up our charts (8 columns and 4 rows)
- We filled in the days using our calendar to help us* (this led to an interesting conversation about abbreviations such as Mon and how we write the date).
- We devised a key. This involved deciding on how to depict the weather conditions, the wind direction and temperature.
- Our charts were ready to be filled in so we did the first day!
 |
| Using the calendar to fill in the days and dates |
Individualization
There are several ways to individualize this project. In our case both girls decided to chart their home town and another place.Maya (11) picked Manchester, UK a city we have visited. Lotta (5) picked Wellington City, NZ because she really wants to go to New Zealand.
The children were also able to personalise their charts by designing their own symbols for the different weather types. They all really enjoyed thinking them up.
 |
| Noah's Weather Chart |
Adapting this activity to different ages
This project is easy to adapt to different ages. For younger children you might need to give more help with drawing the table. I began the lines for Lotta at either end and then she did the joining up using a ruler. I also helped her with the writing by doing dot to dot letters for her to trace. She really enjoyed drawing her weather type symbols including a purple umbrella for rain!Noah (8) was able to do his table by himself. He needed some input particularly for revising the cardinal points and writing the text. He came up with an airplane symbol to indicate wind direction which was very innovative.
For an older child like Maya there are lots of ways to make this more complicated. She was able to do her own research online to check the weather report each day. Concerning her chart she also chose to record the temperature in degrees Celsius rather than as cold, warm or hot like her younger siblings.
 |
| Maya filling in her weather chart for Manchester |
Recording our Results
We filled our charts in for a week. Although the children did forget at least once each, they were able to complete their charts by asking their siblings. Only Maya the eldest ended up with a hole in her data. I felt this was an important lesson for her to learn, that you need to be constant to get good scientific data.I know a week might not seem very long, but I felt it was a good beginning without the project becoming tedious. We have enough data to produce a graph, work out an average and a mean, all things I'll be doing with Maya. Most importantly the children ended the project still excited about it!
If the children show enough enthusiasm I may suggest doing this again over a longer period. I'd also like to make a rain gauge (pluviomètre) and add rainfall to our chart of local weather at least. They also want to make a traffic chart in our local town though we're waiting for it to warm up a bit first as we don't fancy standing outside for an hour in temperatures only just above freezing!
More tips next time on how to keep history and geography fascinating and fun for all ages! As well as more science with Rainbows in a Jar and our list of some of the best science videos out there.
* The gorgeous artwork on our calendar is by Victoria Keeble. It's published by the people at John Austin cards.

No comments:
Post a Comment